In the last few years the customer has been significantly strengthened, or is “socially connected and digitally armed” as smart marketing managers like to put it. If multiple customers rate a product poorly, the provider must respond quickly otherwise the brand can be damaged. And the product development has to be involved in this feedback, too. Clearly, our globalized and web-based brave new world needs a lot more effort in terms of information delivery. This has to be done very quickly with the help of an integrated data backbone for all those who have a strong end-user market footprint. This framework for business activities of the discrete manufacturing and process industry ran like a thread at the conference “SAPinsider Logistics and SCM, Procurement and Supplier Management, PLM, Manufacturing, and CRM”, which took place in the Czech capital from April 27 through 29. It was the annual event of a total of five concurrent conferences organized in fruitful collaboration between SAP (Walldorf, Germany) and SAPinsider, a subsidiary of Wellesley Information Services (Deedham, Massachusetts/USA). Experts from SAP, independent consultants, and customer-led case studies provided a 360-degree perspective on SAP technology, which is otherwise rather difficult to get.The chosen conference format gave every attendee the chance to find at least one track to bring new insights into his business life. A total of four tracks were presented during the three conference days dealing with PLM topics. One good example was the SAP Visual Enterprise Solution Lab overview and demonstration that took place on day two and three of the event. In a joint presentation, Mark Landrosh, Director of Partner Solution Development with SAP, and Robert J. Merlo, Director Marketing with SAP, explained recent enhancements of the visualization suite. Mr Merlo said: “As we move forward, we are combining visual content with business data, analytics and mobility.” This approach aims, for example, to replace manuals, which typically are not properly updated. In this step-by-step 3D instruction, the VP explains to the technician his specific task in order to repair a part. “So, now as an enduser I may have never seen the part before or never executed this process before but I bet you that everyone in this room could do it,” Mr Merlo said emphatically. The manager cited the story of Waters as a testimonial. Waters has some 950 technicians who service its medical systems sold to hospitals all around the world. They get paid by the uptime of these devices. And twice a year it brings all these employees to its headquarters and trains them on new products and how to maintain them. These sessions also serve to refresh training on older products. “It wasn’t uncommon for them to walk into a hospital with a piece of equipment in their hands that they had never seen before. They had to figure out how to replace the old piece and install the new one” — a rather time consuming process. Waters decided to use the SAP Visual Enterprise technology – which originally developed by Right Hemisphere – to create instructions, make them available online and put them on technicians’ tablets. “The instructions are accessed simply with the product number. You can see also metadata, which are selected by tagging that information,” Mr Merlo explained and added another example: “Actually, we have a lot of customers who offer products that they don’t actually intend to build until someone buys them.” These companies show their potential customers detailed 3D models to convince them to buy.Since it is very difficult to visualize large CAD files, Right Hemisphere developed a compression algorithm to shrink them down to very lightweight, easy-to-handle models. “There two reasons why we did this: one is for efficiency in storage. But also for transport efficiency and for downstream usage. This is important because a lot of stakeholders don’t want to use a CAD system,” Mr Merlot explained. This effort makes a lot of sense because our brain can process information better when it is presented graphically. At this stage, Mark Landrosh followed on by explaining the functionality of the new visual software suite, which is divided into five different applications:
- SAP Visual Enterprise Generator for CAD translation, lightweight file generation and “Asset Management activities”.
- SAP Visual Enterprise Access to browse, search and control different versions. It provides dashboards, reporting and administration tools.
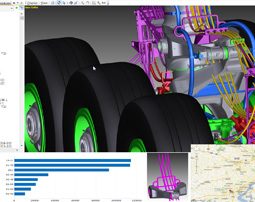
- SAP Visual Enterprise Navigator for high-performance model “fly-throughs”, spatial query and search by metadata context. Also provided are tools for “Visual Business Intelligence”.
- SAP Visual Enterprise Author to create 3D animations, technical document publishing and photo-realistic imagery. The user interface is configurable.
- SAP Visual Enterprise Viewer for all aspects in terms of viewing and mark-up. It is available free of charge.
“SAP Visual Enterprise Generator helps to translate the CAD file and it manages the files for you. It is also a publishing engine. We can take any CAD file you think of and publish a hundred different file formats out,” Mr Landrosh explained. SAP Visual Enterprise Navigator is built for handling massive files. The user can screen the file structure. “When I am looking at a model I only see what is in my selected view,” Mr Landrosh said, referring to the performance capabilities of the software. Once the CAD file is available in the SAP Visual Enterprise format the user can author it, for example to generate 3D-PDFs.At the end of the presentation, Mr Landrosh showed an example to understand what the vendor means by “Visual Analytics”: active links between visualization models and online pokies australia business objects, e.g. to drive the analysis of suppliers. The underlying technology is based on an XML pokie games online structure provided by the partnership with Just Systems. Frank Luppold, Senior Manager of Business Development SAP PLM Solution with Cenit, followed with examples to illustrate how this technology can be transformed into business processes. One scenario was dedicated to the automotive industry. An automotive supplier enriched geometry data with meta-data extracted from SAP ERP, such as descriptions, dimensions, and weights to generate a product data sheet. For this, an assembly was mapped into a two-pages 2D/3D-PDF, where the 3D models, the corresponding MBOM and linked 2D information are depicted. The SAP partner established an “SAP status level” controlled automated process that put together objects, metadata, and graphics (CAD) information.
I got the chance to meet Michael Lynch, VP Solution Management Visual Enterprise with SAP, for a background discussion about the goingtomarket strategy. “After the take-over by SAP we have a more strategic conversation with customers,” the former CEO of Right Hemisphere said. And Mr Lynch is very satisfied about this progress because “when you look at visualization technology, typically the customer thinks of it in terms of a viewer. But what’s really interesting in our technology is because it was built to integrate directly into data sources, which is far more than just viewing a part or product — it is about visualization information in the context of enterprise assets. “Sure, when you think of visualization in that wide scope — Mr Lynch likes to regard it as a very effective communication platform for the whole enterprise — it becomes clear why a far more comprehensive dialogue with the customer is necessary. “With SAP we can have that strategic conversation with CEOs versus technical capabilities only with a viewer,” Mr Lynch said. The technologies embedded are also on a strategic level because they provide access at data source level and not just at product level. The first release of SAP Visual Enterprise, which came out in March this year, was fundamentally about two things: First bringing the SAP Visual Enterprise technology to full compliance with the SAP suite. You should know that one thing SAP customers really care about is that the technology is stable and it has gone through all the standards and compliance steps,” the VP explained. Mr Lynch gave a short outlook of the release to come out next year, which will focus on analytics capabilities: “Imagine you are looking at your product and at the same time you are looking at fault rates — globally — of particular parts. When you drill down into the problems of a product or a plant, this itself turns into a chart. It paints itself in red, green or yellow based on the fault rate, supplier issues, or on-time delivery or whatever you want”. The next step then will be the integration into the SAP Manufacturing suite and also a deeper integration into SAP PLM. So, the future will also be exciting.
06/26/2012 | By BERNHARD D. VALNION, Editor-in-Chief of ECONOMIC ENGINEERING/digitalPLANT


